Thursday, May 29, 2014

XMLStreamException: End Document reached prematurely


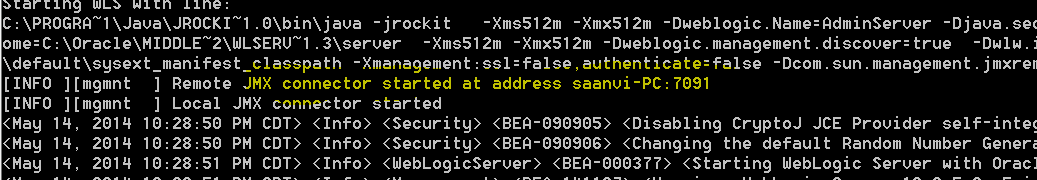
If you notice below error while launching your integrated weblogic server,  Try to delete the corrupted system-jazn file from the below location and replace with correct one.


C:\Users\user\AppData\Roaming\JDeveloper\system11.1.1.6.38.62.29\DefaultDomain\config\fmwconfig


- Please download this attached system-jazn.xml file - Sample System Jazn XML

or the server log file for root cause. If still see no obvious cause, enable the debug flag -Djava.security.debug=jpspolicy to get more information. Error message: Cannot read from policy store. Reason is PolicyStore Error, javax.xml.stream.XMLStreamException: End Document reached prematurely.
at weblogic.security.service.CommonSecurityServiceManagerDelegateImpl.loadOPSSPolicy(CommonSecurityServiceManagerDelegateImpl.java:1398)
at weblogic.security.service.CommonSecurityServiceManagerDelegateImpl.initialize(CommonSecurityServiceManagerDelegateImpl.java:1018)
at weblogic.security.service.SecurityServiceManager.initialize(SecurityServiceManager.java:873)
at weblogic.security.SecurityService.start(SecurityService.java:141)
at weblogic.t3.srvr.SubsystemRequest.run(SubsystemRequest.java:64)
Truncated. see log file for complete stacktrace
Caused By: oracle.security.jps.JpsRuntimeException: Cannot read from policy store. Reason is PolicyStore Error, javax.xml.stream.XMLStreamException: End Document reached prematurely.
at oracle.security.jps.internal.policystore.xml.XmlPolicyStore.buildFromFile(XmlPolicyStore.java:496)
at oracle.security.jps.internal.policystore.xml.XmlPolicyStore.<init>(XmlPolicyStore.java:276)
at oracle.security.jps.internal.policystore.xml.XmlPolicyStoreProvider.getInstance(XmlPolicyStoreProvider.java:100)
at oracle.security.jps.internal.policystore.xml.XmlPolicyStoreProvider.getInstance(XmlPolicyStoreProvider.java:74)
at oracle.security.jps.internal.core.runtime.ContextFactoryImpl.findServiceInstance(ContextFactoryImpl.java:139)
Truncated. see log file for complete stacktrace
Caused By: oracle.security.jps.JpsRuntimeException: javax.xml.stream.XMLStreamException: End Document reached prematurely.
at oracle.security.jps.internal.core.datastore.xml.XmlDataStoreParser.getDataStoreEntryStax(XmlDataStoreParser.java:166)
at oracle.security.jps.internal.core.datastore.xml.XmlDataStoreParser.getDataStoreEntry(XmlDataStoreParser.java:180)
at oracle.security.jps.internal.core.datastore.xml.XmlDataStoreParser.getDataStoreEntry(XmlDataStoreParser.java:187)
at oracle.security.jps.internal.core.datastore.xml.XmlDataStore.loadXmlDataStore(XmlDataStore.java:411)
at oracle.security.jps.internal.core.datastore.xml.XmlDataStore.<init>(XmlDataStore.java:276)
Truncated. see log file for complete stacktrace
Caused By: javax.xml.stream.XMLStreamException: End Document reached prematurely.
at oracle.security.jps.internal.policystore.xml.StaxPolicyStoreParser.processPermission(StaxPolicyStoreParser.java:4801)
at oracle.security.jps.internal.policystore.xml.StaxPolicyStoreParser.processGrant(StaxPolicyStoreParser.java:4309)
at oracle.security.jps.internal.policystore.xml.StaxPolicyStoreParser.processJaznPolicy(StaxPolicyStoreParser.java:4253)
at oracle.security.jps.internal.policystore.xml.StaxPolicyStoreParser.processJaznPolicy(StaxPolicyStoreParser.java:4229)
at oracle.security.jps.internal.policystore.xml.StaxPolicyStoreParser.processAppPolicy(StaxPolicyStoreParser.java:867)
Truncated. see log file for complete stacktrace
<May 29, 2014 11:28:48 AM CDT> <Notice> <WebLogicServer> <BEA-000365> <Server state changed to FAILED> 
<May 29, 2014 11:28:48 AM CDT> <Error> <WebLogicServer> <BEA-000383> <A critical service failed. The server will shut itself down> 
<May 29, 2014 11:28:48 AM CDT> <Notice> <WebLogicServer> <BEA-000365> <Server state changed to FORCE_SHUTTING_DOWN> 

Tuesday, May 27, 2014

Oracle Webcenter Performance Tuning Tips


- Ensure Oracle Coherence is properly configured and working properly

Oracle Coherence Cache - Ensure coherence is enabled, this will reduce significantly performance impact. First time query to UCM get the content and stores in in-memory coherence cache, subsequent calls to UCM will be fetched from coherence cache rather than calling UCM

ADF Client State Token - This value controls the number of pages user can navigate to back without loosing the page state. To reduce the  CPU and memory usage decrease this value in web.xml

<context-param>
       <param-name>
          org.apache.myfaces.trinidad.CLIENT_STATE_MAX_TOKENS
       </param-name>
       <param-value>
          3
       </param-value>
</context-param>

JSP Page Time out - This value determines, how long JSP should stay in memory. This frees up resources in situations where some pages are called infrequently. Configure this value in web.xml

<servlet>
         <servlet-name>
            oraclejsp
        <init-param>
            <param-name>
               jsp_timeout
            </param-name>
            <param-value>
               600
            </param-value>
       </init-param>

HTTP Session Timeout :  This determines how long you want to keep the HTTPSession object alive, This value can be configured in web.xml. Higher the value lead to consume more CPU and memory. Configure this value based on nature of the user accessing your application. If users stays on the application for lesser amount of time, then reduce the value.

<session-timeout> 15 </session-timeout>

ADF View State Compression : By setting 'false' to this ,all non-current view states are compressed before saving in memory, which reduces the heap usage. This value can be configured in web.xml

<context-param>
       <param-name> org.apache.myfaces.trinidad.COMPRESS_VIEW_STATE
      </param-name>
       <param-value> false </param-value>

</context-param>

MDS Cache Size :  By default, MDS cache size is 100 MB, if you notice any error in logs such as JOC region is full, then increase this value to maximum in adf-config.xml


<cache-config> 
<max-size-kb>150000</max-size-kb> 
</cache-config>

MDS Purge Rate : This value will determine to remove older versions meta data automatically every hour. By default, this value is -1, that means no purge. Set the appropriate value based on nature of the application. This can be done by configuring adf-config.xml

<auto-purge seconds-to-live="3600"/>.

Optimizing Cache invalidation

Set Cache Invalidation Interval(Minutes) value to '0' , This can be done by editing Content Repository connection using Enterprise Manager
Follow below link to edit 'Content Repository Connection using EM' : http://fortunefusionminds.blogspot.com/2014/06/how-to-manage-content-repository.html

Set 'expiry-delay' to zero in 'content-coherence-cache-config.xml'

<local-scheme>
   <scheme-name>ContentNodeCaches</scheme-name>
   <expiry-delay>0</expiry-delay>
   <high-units>800</high-units>
</local-scheme>

- Ensure to have below entry in 'httpd.conf' file in OHS 
    LoadModule deflate_module "${ORACLE_HOME}/ohs/modules/mod_deflate.so"

- Reduce the image file size as much as possible. This will significantly improve the performance.

- Define linkCaching.properties file and have below two entries in it
   oracle.webcenter.content.integration.spi.ucm.linkConversion=false
   oracle.webcenter.content.integration.spi.ucm.suppressGetFileUrl=on
    
    - Edit the setDomainEnv.sh (both mserver & aserver) and append below entry at the end of this file
              CLASSPATH="${CLASSPATH}${CLASSPATHSEP}${DOMAIN_HOME}"


Ref : Oracle Webcenter Portal Performance Tuning Tips
http://docs.oracle.com/cd/E27559_01/doc.1112/e28552/webcenter.htm

http://www.ateam-oracle.com/webcenter-11-1-1-8-performance-analysis-feature/

http://docs.oracle.com/cd/E28280_01/webcenter.1111/e12405/wcadm_performance.htm#WCADM12056

http://www.oracle.com/technetwork/articles/enterprise2/zheng-webcenter-perf-1-1927402.html


Saturday, May 24, 2014

How to install JMeter


What is JMeter ?

JMeter is not a browser. As far as web-services and remote services are concerned, JMeter looks like a browser (or rather, multiple browsers); however JMeter does not perform all the actions supported by browsers.

Download Lin k : http://jmeter.apache.org/download_jmeter.cgi

- Download .zip file, copy to your Windows machine C directory and extract it.
- Open Command prompt, Locate to %PATH% /apache-jmeter-2.11\bin directory
- Run Jmeter.bat command

If you notice any errors related to JDK class path, Create a system environment variable as shown below

- Open new command prompt, and run the JMeter.bat,
- If you notice any heap size related errors then modify jmeter.bat as shown below

set HEAP=-Xms1024m -Xmx1024m

- Upon successful configuration of JDK , you should see JMeter window as shown below

Thursday, May 22, 2014

How to see the Trace , Logs and UCM Query response time related information in UCM ?


This blog outlines about how to see logs related information in UCM ?

- Login to Oracle Content Server
- Expand 'Administration' , Choose 'Server Audit Information'

- Choose respective tracing available options from drop down as shown below, Select 'Save' option, Click on 'Update'
Eg : requestaudit, search*, systemdatabase

- Click on 'View Server Output' button as shown below

- This is how you see logs


Thank you for browsing !!!

How to execute UCM Query in Content Manager


This blog explains about how to execute UCM related queries in 'Content Server'

- Login to Webcenter content Server, Expand 'Search' -> 'Standard Search' as shown below
-

- Click on 'show query builder advanced options' as circled below, enter the query and hit search.

How to Monitor Database connections using Oracle EM


This blog explains about monitoring DB connections using Oracle EM


- Login to Oracle EM console corresponding to where your application deployed
- Right click on Cluster/Managed server where your application deployed as shown below, Choose Performance Summary option


- If you want to monitor anything specific , then expand 'Metric Palette' and select whatever you want to monitor. In this example I want to monitor the data source metrics,  I have selected DataSource Metrices and selected whatever needed.


Monitoring Dashboard
- Another way of monitoring application performance is through weblogic console.
- Login to weblogic console, Click on 'Monitoring Dashboard' link as shown below
- This will open the below view, you can select whatever you want to monitor and that will give you the live performance of application.
- Monitor CPU and Memory Usage using Oracle EM
- Monitor Performance Information for Content server using Oracle EM

How to monitor ADF application AM Pool instance and Taskflow Performance using Oracle EM


This blog explains about how to monitor Application Module Instance creation/usage and Taskflow response time using Oracle Enterprise Manager.

- Login to Oracle EM corresponding to where your application deployed
- Expand 'Application Deployments' - > Choose your application - > Right click on your application as shown below


- Choose ADF -> ADF Performance as shown below

- You will see a screen looks like below

Ref : http://docs.oracle.com/cd/E16162_01/admin.1112/e16179/monitor.htm#CHDHAEHB

How to prefix white space in component in ADF ?


Follow below simple trick to prefix a white space just before any content user type in <af:inputText>, You can apply this even to <af:outputText> for some other components as well

set contentStyle =white-space:pre;

What is PS_TXN table in ADF world?


The  PS_TXN Table

The   PS_TXN table stores snapshots of pending changes made to BC4J application module instances. The table manages the B-Tree storage of rows. The snapshot information is stored as an XML document that encodes the unposted changes in an application module instance. Only pending data changes are stored in the snapshot, along with information about the current state of active iterators (i.e. "current row" pointers information). The value of the COLLID column corresponds to the value returned by the   ApplicationModule.passivateState() method.

The  PS_TXN_SEQ Sequence


This sequence is used to assign the next persistent snapshot Id for Application Module pending state management. If the   PS_TXN table contains any rows at the time this sequence is created, the sequence is created so that is   STARTS WITH the integer that is one greater than the   MAX(COLLID) value from the rows in   PS_TXN.

Wednesday, May 21, 2014

How to use HttpWatch to watch Http Trafic


What is HttpWatch ?

HttpWatch integrates with Internet Explorer and Firefox browsers to show you exactly what HTTP traffic is triggered when you access a web page. If you access a site that uses secure HTTPS connections, HttpWatch automatically displays the decrypted form of the network traffic.

This is one of the best tool to measure HTTP Request throughput, Here is the link to download

https://www.httpwatch.com/download/

After successful installation, Open your IE Browser, Right click anywhere on browser and choose 'HttpWatch'. This will open a small window at the bottom of the browser.

To start capturing network traffic, Click on 'Record' button at the beginning of the window as highlighted below and start browsing , you will see how much time it take to get the HTTP response.


Thursday, May 15, 2014

How to Configure JRockit Machine Control with Weblogic Server ?


This blog explains about how to configure JRocket Machine Control with Weblogic Server ?

What is JRockit ?

The Oracle JRockit JVM is the industry's highest performing Java Virtual Machine now built into Oracle Fusion Middleware. It brings industry leading real time infrastructure capabilities with JRockit Real Time and unparalleled JVM diagnostics with JRockit Mission Control.


Follow below link to download and install JRocket

Oracle® JRockit Mission Control

- Configure jmx remote port by modifying setDomainEnv.cmd, startWeblogic.cmd and startManagedWeblogic.cmd file as shown below. You should find these files at Middleware Location

for eg : C:\Oracle\Middleware1116\user_projects\domains\fm_domain\bin

setDomainEnv.cmd

SET JAVA_VENDOR=Oracle
set BEA_JAVA_HOME=C:\Program Files\Java\jrockit-jdk1.6.0_45-R28.2.7-4.1.0
set ENABLE_MNGMNT_CONSOLE=true

startWeblogic.cmd

if "%ENABLE_MNGMNT_CONSOLE%"=="true" (
if "%MNGMNT_CONSOLE_OPTIONS%"=="" (
set MNGMNT_CONSOLE_OPTIONS=-Xmanagement:ssl=false,authenticate=false -Dcom.sun.management.jmxremote.port=7091
)
) else (
set MNGMNT_CONSOLE_OPTIONS=
)


set SAVE_JAVA_OPTIONS=%JAVA_OPTIONS% %MNGMNT_CONSOLE_OPTIONS%

If you want to connect to any specific Managed Server instance using JRocket, then you have to modify startManagedWeblogic.cmd as shown below

startManagedWeblogic.cmd

Configure JMX remote ports repeatedly for each individual managed server instance.

if "%1"=="fm_dev" (
  set MNGMNT_CONSOLE_OPTIONS=-Xmanagement:ssl=false,authenticate=false -Dcom.sun.management.jmxremote.port=7092
) else (
if "%1"=="fm_soa_dev" (
set MNGMNT_CONSOLE_OPTIONS=-Xmanagement:ssl=false,authenticate=false -Dcom.sun.management.jmxremote.port=7093
) else (
set MNGMNT_CONSOLE_OPTIONS=-Xmanagement:ssl=false,authenticate=false -Dcom.sun.management.jmxremote.port=7094
)

)

After updating all these three files, Start Weblogic server by running 'startWeblogic.cmd' script, and you notice JMX remote port in console log as highlighted below
After successful configuration of JMX remote port, start JRockit , Choose 'New Connection' as shown below
- Enter the host name, JMX Remote Port name ( Same as configured above). You don't need to provide any login credentials as we already configured above authentication=false. Test the connection, Ensure Status should be 'OK' as shown below. Click on 'Finish'


After successful connection, Right click on the newly created connection and choose 'Start Console' option

Find source code below here

How to Create Domain, Managed Server using Weblogic Configuration Wizard


This blog explains about simple and basic steps to create domain and managed server instance in Weblogic server using Configuration wizard.

What is Domain ?

A WebLogic Server administration domain is a logically related group of WebLogic Server resources. Domains include a special WebLogic Server instance called the Administration Server, which is the central point from which you configure and manage all resources in the domain. Usually, you configure a domain to include additional WebLogic Server instances called Managed Servers. You deploy Web applications, EJBs, and other resources onto the Managed Servers and use the Administration Server for configuration and management purposes only.
Multiple Managed Servers can be grouped into clusters, which enable you to balance loads and provide failover protection for critical applications, while using a single Administration Server simplifies the management of the Managed Server instances.

- Weblogic Server instance is a Java Virtual Machine(JVM) process that runs the java code- actively working component and responsible for processing client requests.

- Weblogic Server Cluster - Group of Various Managed servers excluding Admin Server - High availability and Load balancing in Production environment.


- Select 'Coniguration Wizard' from Start Menu as shown below
 - Select 'Create a new Weblogic domain'
 - Select appropriate options based on requirement, Leave them default if you don't need any of below mentioned features.
 - Enter valid domain name.
 - Enter Password and Confirmation Password values.
 - Select 'Development Mode' for local use, If you are creating domain for production environment then select other option.
 - Choose 'Manged Servers, Clusters and Machines' selection.
 - Click on 'Add' button and enter valid names for the domain, If you want to have cluster as well, Add Cluster and provide valid name.
 - Select 'Start Admin Server' check box  and hit 'Done', this will start Admin server
 - If you want to start Admin server manually, Then follow below path, run 'StartWeblogic.cmd'

 - Login to Weblogic console

 - Verify the newly created domain as highlighted below.