Java Mission Control
(JMC) is a tool that runs on Oracle JDK to perform Java monitoring, profiling and Java Application performance in
both development and production environments. With this tool we can diagnose
ADF application for any possible memory leaks, stuck threads or identify
slowness of the application.
The
JMX Console is used for monitoring and managing a running JVM instance.
Java Flight Recorder
(JFR) is inbuilt in JMC and it produces detailed recordings about the running
application. Once the recording is done, we can analyze it offline. The
recording data include Memory and CPU usage statistics, Heap Statistics, Thread
Dumps, Garbage collection Statistics, Object allocations, events etc.
JMC is included in JDK Package, It can be found in JAVA_HOME
location.
E.g. C:\Oracle\Middleware\Oracle_Home\oracle_common\jdk\bin
You can run the tool directly from there or through command
line or by adding it JDeveloper as External Tool.
Staring Weblogic with Flight Recording Enabled
You need to start Weblogic server using flight recording enabled,
for the JMC flight Recorder to work.
To do that follow below steps
·
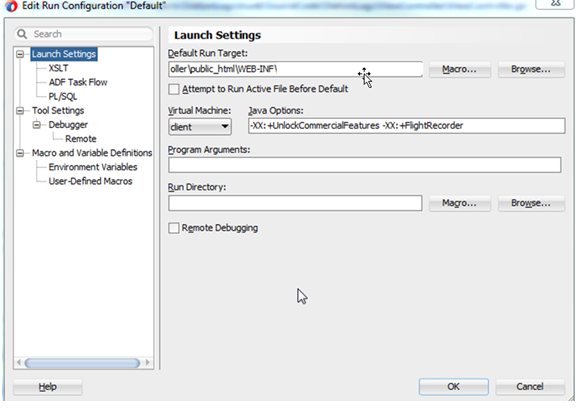
Right click viewcontroller and go to project
properties à Run/Debug à Edit the default profile
configuration (or your profile configuration).
·
Paste the following lines in Java Options
-XX:+UnlockCommercialFeatures
-XX:+FlightRecorder
·
Restart the server and run your application.
Using JMC
·
Open Java Mission control (JMC) after starting
your application.

·
You can see Weblogic server running in JVM
Browser Tab.
Optional Step:
If you are using a remote agent (This step is optional if you
are running application locally)
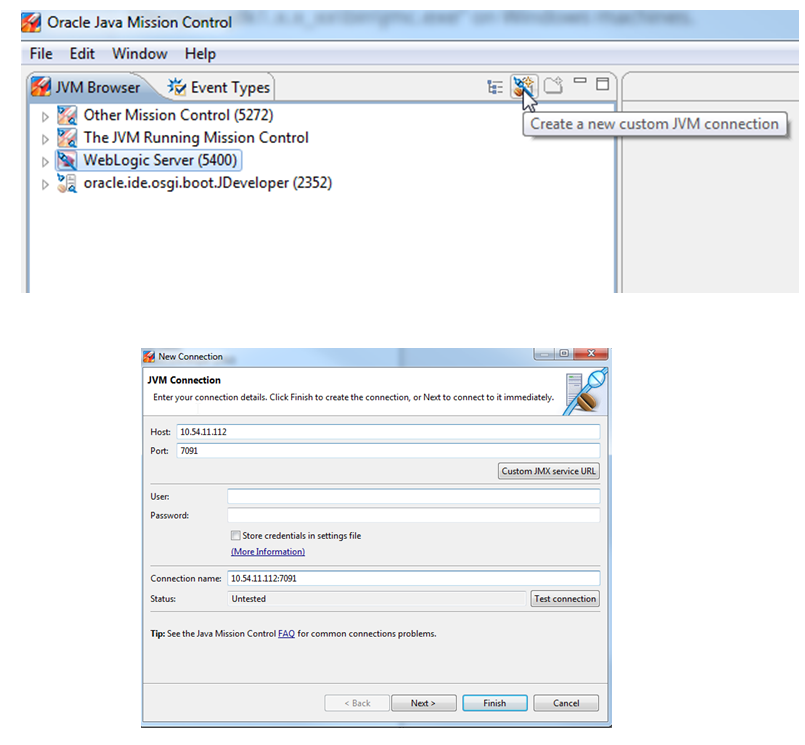
·
Add the following parameters for Project properties
/ as VM arguments for running server
-Dcom.sun.management.jmxremote=true
-Dcom.sun.management.jmxremote.port=7091
-Dcom.sun.management.jmxremote.authenticate=false
-Dcom.sun.management.jmxremote.ssl=false
·
You can add/enable a remote agent using “Create
New Custom JVM Connection “link
·
In JMX Console you can see the live CPU, Memory
usage in Graph , also there are tabs at the bottom to see detailed thread and
memory usage.


q
Flight
Recorder – recording data
·
Right click on Weblogic server and select “Start
Flight Recording”.
·
In Create flight recording dialog, choose name,
and Recording time. Click finish to start flight recording

·
You can check Flight recorder by expanding
Weblogic server à
Flight Recorder. Also can stop and dump or edit the recording while it is in
progress

·
Once recording is done, JMC opens the recording
automatically or open it manually from location you choose to save or from
default location (C:\Users\<user>\.jmc\5.3.0\).
·
Now you can analyze the data to find the
problems
Analyzing a sample application:
·
Image below shows that High Memory Usage and Full
Garbage collection was running sometimes, at that point application slows down
and even freezes.

· Below Data shows there are 2 stuck
threads and are running with high percentage and pointing to a method in the
code.

·
Other Example Data

Check the
below links for information and tutorials about how to analyze the JMC Flight
recording.
·
Java
Mission Control and Flight Recorder Demo Series http://www.oracle.com/webfolder/technetwork/tutorials/obe/java/mc-jfr/index.html
More
Information:
No comments:
Post a Comment